Melbourne Property Market Update November 2026
Whether you’re buying, selling or investing, keeping up with the Melbourne property market can feel like a full-time job. Prices shift, listings rise and fall with the seasons and auction results can change the mood of the market from one weekend to the next.
That’s why we put together this monthly Melbourne property market update. Each month we break down what’s happening with Melbourne house prices, median values, new listings, auction clearance rates and rental conditions, so you can make decisions based on real data rather than headlines.
We’ll also look at what’s driving the numbers, from interest rates to buyer demand and housing supply, and what it could mean for you over the coming months.
Melbourne's property decline slows
Melbourne’s rate of decline is easing, with values falling 0.7% over the past month.
It appears the decline peaked in July, when values fell 1.5%, and the pace of falls has moderated since.

Meanwhile, Brisbane, Adelaide and Perth, which were previously among Australia’s strongest property markets, are now recording some of the sharpest monthly falls.

Price declines by value segment
As is common in both downturns and upswings, the top end of the market tends to move first and furthest.
In the three months to September, values in Melbourne’s lowest quartile fell 1.3%, while the most expensive quartile fell 4.4%.
For anyone thinking about upgrading, this is good news.
With premium properties falling faster than entry-level homes, the price gap between your current home and your next one has narrowed, making that step up more achievable.
Selling isn’t the only option when you upgrade, either. If you bought your current home before 12 May 2026, you may be able to keep it as an investment property and still negatively gear it under the grandfathering provisions of the new rules. This “upgrade and retain” strategy won’t be available to anyone buying an established property from here on, so it’s worth looking at how your current loan is structured before making your next move.

Houses vs units
The same pattern is playing out between houses and units. In September, Melbourne house values fell 0.9%, while unit values fell just 0.3%.
The trend is even clearer over the past 12 months, with house values down 7.3% compared to a 3.8% fall for units.
Houses generally sit at the higher end of the market, so it’s no surprise they’re seeing larger falls, in line with the trend across price quartiles. Units, with their lower entry price, are proving more resilient as buyers focus on affordability.
For unit owners looking to make the move into a house, this is another positive sign. With house values falling faster than units, the gap between the two has narrowed, which could make now a good time to consider that next step.
While units have held their value better through this downturn, it’s worth keeping the longer term in mind. Over the past 20 years, houses have generally delivered stronger capital growth than units, largely because more of their value sits in the land, which appreciates over time while buildings depreciate. That said, a well-located unit in an area where land is scarce can still outperform a poorly located house, so the right choice depends on your goals and strategy rather than the property type alone.

The bigger picture: a decade of underperformance
The longer-term figures tell an even more interesting story.
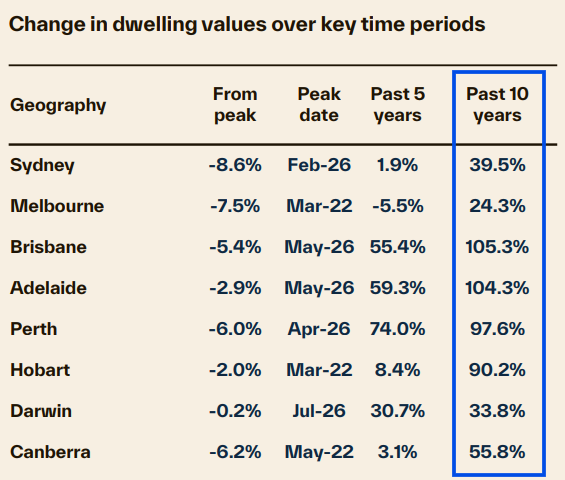
Over the past decade, Melbourne dwelling values have risen just 24%. By comparison, values in Brisbane and Adelaide have more than doubled, while Perth has come close to doing the same.
Melbourne’s median dwelling value now sits at $780,550, still 7.5% below its March 2022 peak.
We see this prolonged period of underperformance as one reason Melbourne could be well positioned when the property cycle eventually turns. With Victoria’s state election approaching in November, a potential change of government could also breathe new life into the state’s economy and help restore confidence.
We’re also seeing resilience in more affordable properties, particularly well-located apartments and villa units. When comparing medians, Melbourne’s unit market remains very affordable relative to many other capital cities.
While it’s too early to call a recovery, Melbourne’s relative resilience could be an early sign that market momentum is starting to shift.
Homes are taking longer to sell in Melbourne
Melbourne homes are spending noticeably longer on the market. In September 2026, the median days on market was 42 days, up from 28 days in September 2025. That’s two extra weeks, or a 50% increase, in the typical time it takes to sell.

Sales volumes have also eased, falling 5.0% in the 12 months to September 2026. While that’s a decline, Melbourne has held up better than the broader market, with national sales volumes down 6.4% and the combined capitals down even further at 9.1%.
For buyers, a slower market means more time to research, compare properties and negotiate, with less pressure to make snap decisions.

Listings: more choice for Melbourne buyers
Melbourne buyers have significantly more choice than they did a year ago. Total listings were up 30.3% in September 2026 compared to September 2025, well ahead of the national increase of 21.6%.
New listings rose 7.9% in Melbourne, broadly in line with the national rise of 8.1%. The bigger story is older listings, meaning properties that have been on the market for more than 180 days. These were up 29.6% in Melbourne, almost three times the national increase of 10.5%.
Auction results tell a similar story. Melbourne’s clearance rate has sat below 50% since March, with the most recent result coming in at 42% for the week ending 25 October.
In other words, fresh stock is still coming onto the market, but properties are staying listed for longer. Combined with homes taking an extra two weeks to sell and sales volumes easing, it all points to one thing: conditions are currently in buyers’ favour.
For buyers, this means more properties to choose from, less competition and more room to negotiate. For sellers, it reinforces the importance of pricing realistically and presenting your home well from day one, so it stands out from the growing pool of properties already on the market.

Buyer sentiment lifts in Melbourne
Despite the latest rate rise, buyer sentiment improved in October, with both confidence in buying a home and expectations for house prices edging higher.
The Westpac-Melbourne Institute “time to buy a dwelling” index rose 3.4% to 88.4, up from 85.5 in September. A reading below 100 means more people think it’s a bad time to buy than a good time, so sentiment remains weak overall. However, it’s noticeably less negative in Victoria and New South Wales, where both state indexes sit at 93. Interestingly, these are the states where prices have fallen the most, suggesting some buyers see lower prices as an opportunity.
House price expectations also picked up, with the index rising to 115.1 in October from 110.3 in September. That follows a steady September and a steep 36% fall over the previous six months. Victoria led the way, with expectations jumping 11% in the month, well ahead of a 4.3% rise in Queensland and little change in the other major states.

Rents and yields: Melbourne stands out for investors
Rents continue to rise across the country, increasing 5.5% nationally in the 12 months to September, matching the 5.5% rise across the combined capitals. Melbourne rents grew at a slightly slower pace of 4.9%, while Darwin recorded the largest increase of any capital at 11.6%.
Where Melbourne really stands out is rental yields. The city’s gross rental yield is now 4.1%, higher than both the national average of 3.9% and the combined capitals at 3.7%. Breaking it down further, Melbourne houses are yielding 3.5%, while units are delivering a strong 5.2%.
Notably, Adelaide, Brisbane and Perth are recording lower yields than Melbourne, despite traditionally being known as higher yielding markets. Strong price growth in those cities over recent years has pushed values up faster than rents, compressing yields.

Melbourne also offers relative affordability when comparing median values. The city’s median house value is now lower than Brisbane, Perth, Canberra and Adelaide, and its median unit value sits below Brisbane, Perth and Adelaide.

That’s a gap of more than $230,000 between Melbourne and Brisbane houses, and more than $200,000 for units.
With lower entry prices, stronger yields and values still below their 2022 peak, Melbourne could start to attract renewed interest from investors, particularly in the unit market, where yields are highest and prices remain very affordable compared to other major capitals.
Want more expert analysis on the Melbourne property market?
Tune in to our latest market update on The Property Trio podcast, where we unpack this month’s numbers, share our take on where the Melbourne market is heading and cover plenty more along the way.
And if you're nterested in what’s happening beyond Melbourne, our Property Market Update covers the latest data and trends across every state and territory.
How does this affect your plans?
Whether you’re buying, selling, investing or refinancing in Melbourne, the market is shifting and the right strategy matters more than ever. If you’d like to talk through your next steps, property plans or mortgage strategy, get in touch with us today.
Our team of experts is here to guide you through the complexities of the Melbourne market and help you achieve your property goals.